
This assessment of the carbon fibre market is a composites market report produced jointly by Carbon Composites e.V. (CCeV) and the AVK. The section of the market report focusing on carbon fibre draws on information and figures supplied by members of CCeV, among others. These members are responsible for around 40% of global carbon fibre production in 2012 – a total annual production capacity of approximately 44,000 tonnes according to the latest figures.
The global carbon fibre market
Additional sources of information were included for the production of the Market Report 2013. CCeV adds that it was possible to refine last year’s data and offer even greater precision. This is also the reason for any differences between the information contained in this and previous market reports. According to the revised figures, demand in the years up to and including 2011 is now believed to have been somewhat higher than was the case in 2012. Growth in demand until 2015 is now expected to be slightly lower than previously forecast although still high at a rate of over 13%.
CCeV adds that according to the figures it had available, the increases in capacity announced in 2011 and 2012 have for the most part been implemented and the companies are beginning to expand their market positions more actively.
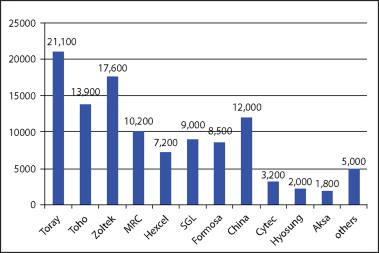
- Toray has increased its carbon fibre capacity to 21,100 tonnes.
- Russian newcomers Argon Ltd. (CJSC Holding Company Composite) and Alabuga Fibers LLC have each expanded their capacity by 1,500 tonnes/year.
- Taekwang Industrial Co Ltd (Ulsan/South Korea) started carbon fibre production in March 2012 and has expanded its capacity to 1,500 tonnes/year in 2013.
- Hyosung began production of approximately 2,000 tonnes/year (small tow <48k/2,000 tonnes/year in the city of Jeonju/South Korea).
- The capacity of Kemrock Industries and Exports Ltd. is now estimated at 650 tonnes/year.
- Zoltek Corporation has also completed the investment projects it announced. Zoltek honored for new $15 million carbon fiber plant in St. Peters. Total capacity for 2013 is now stated at approximately 17,600 tonnes/year [1].
- Chinese companies currently have a carbon fibre manufacturing capacity of around 12,000 tonnes/year. This is predicted to expand to approximately 22,000 tonnes/year by 2020. The main players in this region are: Jiangsu Hengshen Fibers Materials Co. Ltd. (3,500 tonnes); Zhongfu Shenying Carbon Fibers Co. Ltd. (3,200 tonnes), Dalian Xingke Carbon Fibers Co. Ltd (1,670 tonnes), Weihai Tuozhan Fibers Co Ltd. (2,150 tonnes).
- SGL Group has acquired the Portuguese fibre manufacturer Fisipe. This provides the manufacturer of carbon fibres and carbon fibre reinforced plastics (CRP) with an additional source of raw materials.
- MRC, a 100% subsidiary of Mitsubishi Chemical Holdings, has completed its acquisition of TK Industries, a German-based manufacturer of carbon fibre multiaxial fabrics.
- Toray is in the process of acquiring Zoltek.
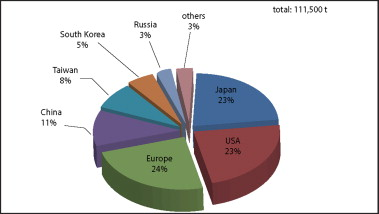
For 2013, the study presents a theoretical total capacity (depending on the production portfolio of the manufacturer – small tow or large tow) of approximately 111,500 tonnes of carbon fibre. In Figure 2, new capacity in Russia, South Korea and India is represented as a combined total under ‘Other’. This capacity is supplemented by around 4,000 tonnes/year of additional pitch-based carbon fibre capacity in Japan, the USA and China. The greatest installed carbon fibre capacity is to be found in the USA, Europe (including Turkey) and Japan, each of which account for some 23-24% of global output. China has now expanded its production to around 11% of total global capacity. The remainder is distributed between Taiwan, South Korea, Russia, India and Mexico.
The global carbon composites market
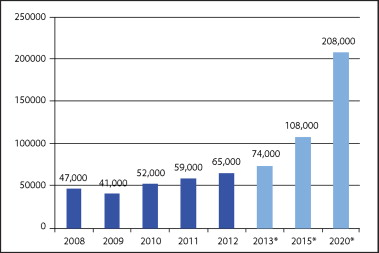
As the vast majority of carbon fibre produced (over 97%) is processed into composite materials of all types, the carbon composites market develops at the same pace as the carbon fibre market. The tonnage of CFRP is naturally much higher, however, due to the addition of the matrix component.
Market data and developments (2012)
According to the CCeV survey, 95% of the carbon fibre used in composite materials is processed into carbon fibre reinforced plastic (CFRP). The rest is used in composites with matrices based on carbon, ceramic or metal. These materials are used in specific applications, such as aircraft or vehicle brake discs.
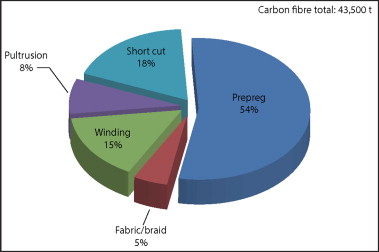
| Around 54% of the carbon fibre produced worldwide is used for manufacturing prepregs. |
A variety of different production processes are used in the manufacture of CFRP materials/components. These are required for processing the various semi-finished fibre products. The survey reports that looking into this area of the market shows that little has changed since 2012. Prepregs continue to dominate in the production of CFRP parts. Around 54% of the carbon fibre produced worldwide is used for manufacturing prepregs, of which 42% are based on unidirectional fabrics and 12% on woven fabrics. Just 5% of carbon fibre is used to make semi-finished products such as fabrics and braids for example, which are in turn used to make CFRP parts via an infiltration process (for example, RTM). CCeV adds that the winding (approximately 15%) and pultrusion (around 8%) processes are also important techniques in CFRP production. In these processes, the fibres are used in the form of yarns. In this year’s market report, CCeV says that the additional data and information now available enable analysis of these areas of application in detail. Sales and revenues for each application area can be highlighted and the regional distributions of the most important application areas studied.
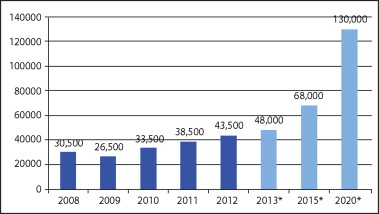
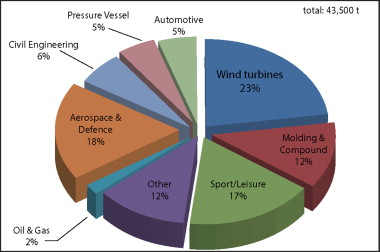
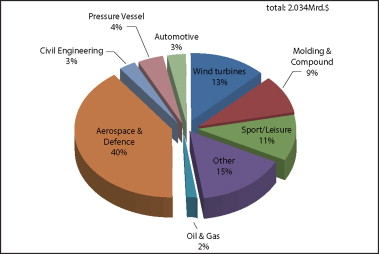
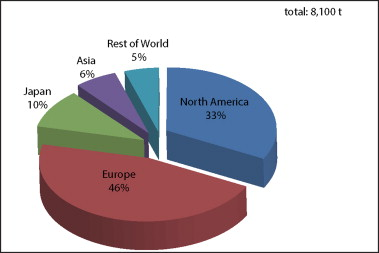
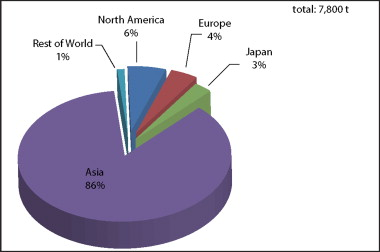
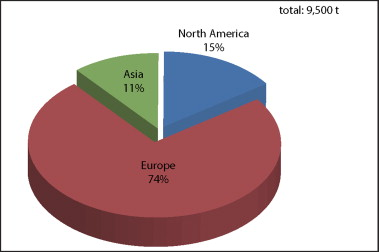
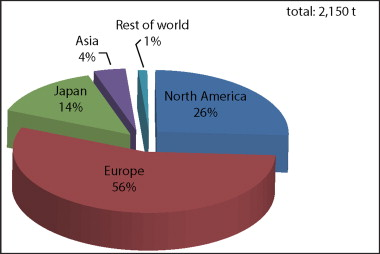
Overall, CCeV reports that the most important use of carbon fibre (23% of a total of 43,500 tonnes) continues to be in rotor blades for wind turbines. This area is closely followed by aerospace and defence and sport/leisure (18% and 17% respectively). The fourth-largest application area for carbon fibre (12%) is in moulding and compound. The values of global carbon fibre sales in these areas ($2.034 billion) do not, however, correspond to the volumes of carbon fibre used in the various application areas. The report adds that aerospace and defence, for example, uses only 18% of the total quantity of carbon fibre but accounts for around 40% of the value of global sales. This is because costs in this sector are significantly greater due to the high quality standards, licenses and inspections. In contrast, the largest segment by volume, wind turbines (23%), generates only approximately 13% of global revenues. The third-largest market segment, sport/leisure (17%), is responsible for around 11% of revenues. The CCeV report adds that the regional distribution of carbon fibre consumption reflects the levels of activity and development involving CFRP in the respective economic regions. Due to various CFRP projects in the aerospace industry being conducted by the major aircraft manufacturers, European companies consume 46% of the quantity of carbon fibre used worldwide in the aerospace and defence sector while their counterparts in the USA use a further 33%. Furthermore, 86% of the carbon fibre used in the area of sport/leisure is processed in China, a result of pricing pressure and the fact that this sector is now primarily dominated by mass production methods. In the largest market segment by volume, wind turbines, the majority of carbon fibre is used in Europe. The principal manufacturers of wind turbines are based in Europe, a fact clearly demonstrated by its consumption of 74% of the carbon fibre used in this sector. The USA is the second largest region in this area with 15%. The Asian market share is expected to rise from the current level of 11% to 15% by 2020 with most of this business being taken from Europe. The global use of carbon fibre in the automotive sector is distributed between the major car building nations/regions, such as Europe with 56%, North America with 26% and Japan with 14%.
Part 2 of Carbon fibre reinforced plastics market continues growth path looks at trends, outlook and risks.
This article was be published in the November/December 2013 issue of Reinforced Plastics magazine.
The digital edition of Reinforced Plastics is distributed free of charge to readers who meet our qualifying criteria. You can apply to receive your free copy by completing the registration form.


