
Established in 2008, and updated annually, the report includes real installed power capacities per renewable energy generation source, per country, for the entire world. The information contained therein is based on publicly available data on various organisations active in the different renewable energy markets, as well as expert insights from a variety of consultants familiar with the renewable energy market sector.
According to the REMIPEG report, electricity generation coming from renewable energy sources in 2013 was about 5 PWh, producing a total installed capacity of 1,658 GW. (For 2013, total worldwide power generation was about 23 PWh.) More importantly, the total annual electricity generation from renewables represents a share of more than 20%. Compared to the total primary energy consumption worldwide, this represents a contribution of around 3%.
This is in line with trends observed over the past decade. During that period, the demand for renewable energy worldwide has experienced an increase as a result of various factors associated with environmental, political and economic trends. First, strict environmental policies have had the effect of limiting CO2 emissions from conventional power plants, thereby encouraging the construction of renewable energy plants. Second, the constant increase of fossil fuel prices has helped to deploy clean, alternative energies. Finally, governments around the world have encouraged the production (and consumption) of renewable energy with incentives for kWh generated.
At the same time, however, the economic crisis of 2009 has brought many challenges. For instance, economic pressures have forced governments to remove or curtail the various incentives to generate electricity from renewable sources. Spain, Italy and Greece are prominent examples. These changes, in turn, reduced investors' confidence in the renewable energy sector. According to a study conducted by Bloomberg New Energy Finance (BNEF), the amount of clean energy investment worldwide in 2013 fell 11%, to 254 billion dollars, after declining 10% in 2012. This despite the continually declining costs of photovoltaic systems [1].
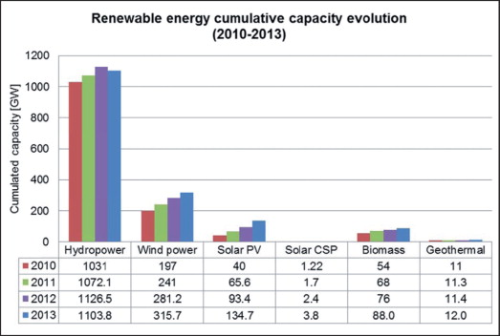
| Renewable Energy Type | Cumulated installed capacity 2013 | New installed capacity 2013 | Growth of cumulated installed capacity | Growth rate of newly installed capacity (2012-2013) | Estimated electricity generation 2013 |
| [GW] | [GW] | [%] | [%] | [TWh/y] | |
| Hydropower | 1,103.8 | 39.9 | 5% | 35% | 3,704.9 |
| Wind power | 315.7 | 35.4 | 13% | -21% | 683.0 |
| Solar PV | 134.7 | 36.3 | 41% | 25% | 140.6 |
| Solar CSP | 3.8 | 1.2 | 56% | 63% | 6.8 |
| Biomass | 88.0 | 4.3 | 5.1% | -55% | 308 - 616 |
| Geothermal | 12.0 | 0.5 | 4% | 42% | 73.0 |
| World total | 1,658.0 | 117.5 | 21% | 15% | 4916.4 - 5224.4 |
Global Investment Trends
Research shows a significant increase in renewable energy investments (55%) has been made in the Japanese market, primarily due to the difficulties the country faced in filling the gap from the changes in its nuclear power system. Meanwhile, in Europe, it is estimated that renewable energy investments plummeted by 45%. [1]. Lahmeyer International research indicates that this reflects changes primarily in the photovoltaic sector.
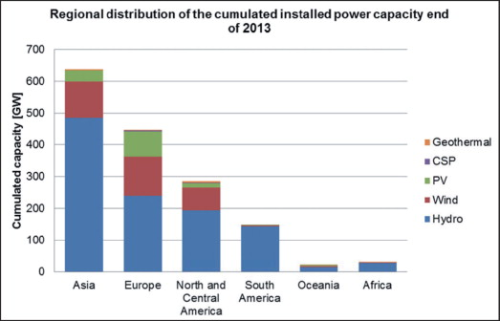
At the heart of the volatility in renewable energy investment are lingering effects of the financial crisis, which caused a reduction in the investment in renewable energies in many countries. The industry witnessed a considerable shift from established markets in Europe and North America to developing and emerging markets over the past few years. Lahmeyer research shows installations in North America and Europe fell from 46% to 32%, while projects across Asia and South America rose from 51% to 65%. Africa, which is still comparatively small in terms of renewable energy development, represented the second-largest market for new installations, growing at a rate of 16%. (See “Worldwide installed power capacity” table in this section.)
Sector Activity
Taking into account all the renewable energy technologies, the cumulative installed power capacity grew from 1,591 GW to 1,658, GW during 2013, with hydro power leading the pack. In fact, hydropower represented more than three times the cumulative capacity as the second-largest sector; wind. Still, the wind sector had the highest contribution of new installed capacities, with about 40 GW. This source constitutes 66% of the total installed capacity and around 74% of the total electricity generation of the renewable energies mix.
Although the wind power market year-to-year growth rate was negative — mainly the result of a significant stop of the US market due to the delay in prolongation of PTCs — wind still contributes significantly to the market in terms of renewable energy capacity.
Another star performer was the geothermal power market, which added 532 MW of new capacity connected to the grid. In fact, newly installed capacities were more than three times the number achieved the previous year, the report showed. Although the geothermal market is still comparatively small compared to the overall renewable energy industry, analysts believe its share of the market could grow significantly in the coming years — if current trends persist.
The solar energy sector also shined brightly, as new installations ever-so-slightly surpassed new projects in the wind energy sector.
On the whole, the newly installed renewable electricity capacity increased by a mere 6%, compared to 2012. Again, this was due primarily to the reductions in newly installed capacity in wind and biomass.
For more details on the respective renewable energy sectors, please download the individual reports:
2013 Lahmeyer REMIPEG Report: Hydropower 2013 Lahmeyer REMIPEG Report: Wind 2013 Lahmeyer REMIPEG Report: Solar PV 2013 Lahmeyer REMIPEG Report: Solar Thermal 2013 Lahmeyer REMIPEG Report: Biomass 2013 Lahmeyer REMIPEG Report: Geothermal
About the authors
Dr. Patric Kleineidam is Head of the Wind Energy Department at Lahmeyer International GmbH, Bad Vilbel
Thomas Klinge is Head of Department, Renewable Energies, at Lahmeyer International GmbH, Bad Vilbel
Prof. Dr. Martin Kaltschmitt is Managing Director of Deutsches Biomasseforschungszentrum in Leipzig and Head of Institute of Energy and Process Engineering at TU Hamburg-Harburg
Bernd Metzger is Business Development Director Hydropower at Lahmeyer International GmbH, Bad Vilbel
Dr. Roman Vorobyev is a Hydropower Expert at Lahmeyer International GmbH, Bad Vilbel
Anil Bindal is Project Manager, Wind Energy, at Lahmeyer International GmbH, Bad Vilbel
Ciro Rapicano is a Solar Power Expert at Lahmeyer International GmbH, Bad Vilbel
Alex Loosen is a CSP Expert at Lahmeyer International GmbH, Bad Vilbel
Jan Dörr is an Intern at Lahmeyer International GmbH, Bad Vilbel
Sebastian Janczik is a Geothermal Expert at the Institute of Environmental Technology and Energy Economics (IUE), Hamburg University of Technology (TUHH)


